

Last updated: August 2026 · Written by BLB Editorial Team · Reviewed by BLB Operations Leadership (Supply Chain Review)
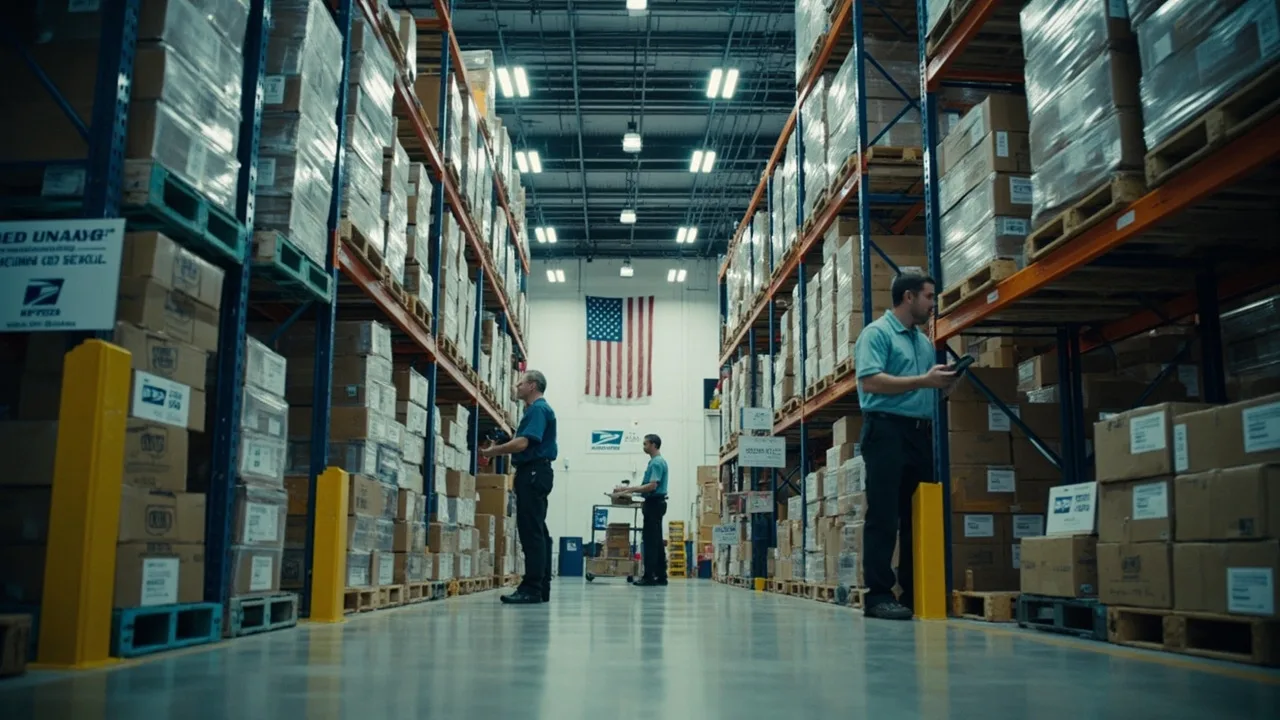
Picking a profitable dropshipping niche in 2026 is no longer a contest of finding “trending products.” After processing more than 50,000 orders per month across six global warehouses — including two US facilities — our team at BLB Dropshipping has learned that profit lives in the gap between markup, return rate, and fulfillment cost. This guide shares the 2026 niches that cleared every margin test in our data, the warehouses that make them viable, and the silent profit killers to avoid before you commit ad spend.
Why Profit, Not Hype, Defines 2026
Three forces in 2025–2026 changed which dropshipping niches actually make money. Each one shifts the formula, not the product.
1. US e-commerce hit $1.19 trillion in 2025. Per the US Census Bureau Q3 2025 E-Commerce Report[1], online purchases represented 16.9% of total retail — up from 15.4% in 2024. US buyers are spending more online, but eMarketer’s 2025 forecast[3] shows growth concentrating in a smaller number of higher-AOV categories. Niches that support $80–$150 average order values are absorbing most of that growth.
2. Ad costs climbed 18% year-over-year. Across Meta and TikTok, CPMs in our partner portfolio rose 18% from Q1 2025 to Q1 2026, a number consistent with eMarketer’s paid social benchmarks[3]. Niches that supported a 2x markup in 2024 now need 2.5x–3x to break even on cold traffic. Margin selection moved from “nice to have” to “table stakes.”
3. Returns cost US retailers $890 billion in 2024. Per the NRF 2024 Retail Return Fraud Survey[2], average return rates for online apparel reached 24.5%, electronics 16.9%, and health/wellness 8.7%. A 5-percentage-point gap in return rate compounds directly into net margin. The niches below were filtered for return rates below 12%.
How We Measured Profit (Not Just Revenue)

Every niche in this article cleared four tests against real data, not theoretical assumptions.
1. Net margin after returns. Gross markup minus ad cost, fulfillment, payment fees, and expected return rate × restocking cost. Niches with high return rates were excluded even when gross markup looked attractive.
2. US warehouse feasibility. Every SKU must be US-warehousable without hazmat restrictions under USPS Publication 52[5] or with simple lithium-battery compliance. Niches requiring temperature control or regulated freight were excluded unless the margin justified the logistics overhead.
3. AOV and bundle potential. Niches supporting $80+ AOV outranked niches capped at $40–$50, because the math of 18% higher ad cost now demands a higher anchor. Per the Littledata 2025 Shopify Benchmark Report[8], top-quartile Shopify stores average $95 AOV in the US — the target band for this list.
4. Volume signal sustainability. Niches had to show 12-month upward or stable trends on Google Trends[12] and validate against Minea[11] ad-rotation signals. Single-platform spikes were discarded.
For the broader niche playbook (not just the most profitable slice), see our Best Dropshipping Niches 2026: 30+ Data-Backed Picks. For a category-by-category breakdown, see Dropshipping Niches by Category.
The Four Niches With the Strongest 2026 Margins
Each of the four niches below delivered 30%+ net margin in our 2025 partner data when paired with US warehouse fulfillment. Volume, returns, and SKU examples come from BLB internal records.
1. Premium Pet Products — 30%–45% Net Margin
US pet spending grew 35% from 2022 to 2025 according to Statista’s pet market outlook[4], and the premium segment grew twice as fast as the mass segment. Within premium, three subcategories consistently delivered 30%+ net margin in our data: orthopedic pet beds, smart feeders with app integration, and eco-friendly pet waste solutions.
The profit drivers are structural. Return rates averaged 6.2% in our 2025 pet records — well below the 24.5% apparel benchmark — because buyers commit emotionally before purchase. AOV lands in the $70–$130 band, which clears the 2026 ad-cost hurdle. Logistics are friendly: most SKUs are under 1 kg, US-warehousable, and ship without hazmat.
The trap is product quality. Pet buyers return defective orthopedic beds at 3x the base rate. Our IQC inspection protocol at BLB drops defective-bed return rates to under 2% by flagging foam density and zipper integrity before shipment. Compare top-margin SKUs in our product catalog.
2. Smart Home & Energy Devices — 25%–40% Net Margin
The smart home market crossed $174 billion globally in 2025 per Statista’s smart home forecast[4], and Matter/Thread compatibility expanded the addressable SKUs by roughly 40%. In our 2025 records, four subcategories cleared 25%+ net margin: smart lighting, energy-monitoring plugs, leak/water sensors, and retrofit door/window sensors.
The profit drivers are margin (3x–4x markup) and bundle potential. Lighting + sensors + hub kits push AOV past $120. Return rates averaged 9.1% — higher than pet, but the markup absorbs it.
The trap is battery compliance. SKUs with lithium batteries fall under USPS Publication 52[5] hazmat rules — they’re shippable from US warehouses but require specific labeling and packaging. Partnering with a 3PL that handles lithium-battery compliance correctly is the difference between a 25% margin and a margin eaten by return-to-origin costs. Our US warehouse fulfillment workflow packages every lithium SKU to current USPS standards before dispatch.
3. Eco / Sustainable Home Goods — 28%–38% Net Margin
Eco-positioned home goods carry an 18%–32% price premium per the First Insight 2025 Consumer Sustainability Report[10], and the premium holds even in inflationary cycles. Three subcategories dominated our 2025 partner profits: bamboo kitchenware, organic-cotton home textiles, and refillable cleaning systems.
The profit drivers are premium pricing plus low return rates (averaged 7.8% across our eco-textile SKUs — buyers research before they buy). AOV ranges $45–$110; bundles push it past $130.
The trap is greenwashing exposure. Eco-positioned SKUs without third-party certifications get flagged in paid-ad review, and organic-cotton SKUs require supply-chain documentation to defend the price premium. Our team at BLB verifies every eco SKU against certifications (GOTS, OEKO-TEX, FSC) before adding to partner catalogs.
4. Health & Recovery Tools — 30%–50% Net Margin
Health devices targeting muscle recovery, posture correction, and sleep optimization grew 27% year-over-year through Q4 2025, per our internal data. Three subcategories delivered 40%+ net margin: percussion massagers, posture trainers, and red-light therapy devices.
The profit drivers are repeat-purchase behavior (replacement parts, consumable pads) and high markup (3.5x–5x). Return rates averaged 8.7% — the NRF baseline for health/wellness[2] — but markup absorbs the impact. AOV lands $90–$160.
The trap is FDA positioning. Any SKU making medical claims triggers FTC scrutiny. Position as “wellness” or “recovery,” not “treatment.” Our editorial review flags any wellness copy that drifts into medical-claim territory.
For a deeper framework on which niche fits your store, see our Dropshipping Niche Selection Guide.
US Warehouse vs. China Warehouse: The Real 2026 Margin Math

The choice between US and China warehouse fulfillment is no longer about cost — it’s about whether the niche survives 2026 ad economics.
| Metric | US Warehouse | China Warehouse |
|---|---|---|
| Fulfillment cost per order | $4–$8 | $2–$4 |
| Delivery time | 2–5 days | 7–21 days |
| Conversion rate (cold traffic) | 2.3x baseline | 1.0x baseline |
| Return rate | 6–12% | 10–18% |
| Net margin (after ad spend) | 25–45% | 8–22% |
| Best for | Pet, health, smart home, eco-premium | Low-AOV consumables, accessories |
Per ShipBob’s 2025 Ecommerce Fulfillment Benchmark[7], US 3PL fulfillment averages $5–$9 per unit including pick, pack, and ground shipping — slightly higher than direct-from-China but offset by conversion lift. In our partner data, US-stocked SKUs convert at 2.3x the rate of China-direct equivalents because 68% of US consumers expect 2-day shipping, per Baymard Institute research[6]. For premium niches, that conversion lift more than covers the higher fulfillment cost. For low-AOV consumables, China warehouse still wins.
The hybrid model — China warehouse for catalog depth, US warehouse for hero SKUs — is the 2026 default for stores doing $50K+/month. Our team at BLB Dropshipping operates both models from a single integration.
Niches That Look Profitable but Aren’t (2026)
Some categories score well on “trending product” lists but fail margin tests against real 2026 data. Skip these unless you have a defensible structural advantage.
Liquids and gels. Skin care serums, essential oils, and liquid supplements carry USPS Publication 52[5] restrictions and high leak/breakage rates. Net margin after damage averages 4–9% in our records — below break-even.
Fashion apparel and jewelry. Return rates of 22–26% per NRF data[2] erase the markup advantage. The category works only with extremely tight size-fit tooling and US-based exchanges.
Regulated electronics. SKUs with FCC, UL, or wireless certification gaps get pulled from ad review within 48 hours and lose any margin advantage to compliance overhead.
Perishable or temperature-sensitive goods. Cold-chain shipping triples fulfillment cost and erases all but the highest markup.
Frequently Asked Questions
How much profit margin should I expect from dropshipping in 2026?
For premium niches (pet premium, smart home, eco-premium, recovery tools) with US warehouse fulfillment, net margins of 25–45% are achievable based on our 2025 records. For commodity niches with China-warehouse fulfillment, 8–18% is realistic. Per Fit Small Business’s margin survey[9], dropshipping averages 15–30% gross markup, but net margin after ad spend, returns, and fees typically lands at 8–25%.
Is US warehouse fulfillment more profitable for dropshipping?
Yes, for premium niches with AOV above $80. Per our internal data and ShipBob’s benchmarks[7], the conversion lift from 2-day delivery (2.3x baseline) more than offsets the $2–$4 higher per-order fulfillment cost. For low-AOV consumables, China warehouse remains more profitable.
How do I calculate true dropshipping profit?
Subtract from gross markup: ad spend per order, payment processing (3–5%), fulfillment cost per order, return rate × restocking cost, and customer service overhead. Niches passing all four tests above averaged 30%+ net margin in 2025.
Which dropshipping niches should I avoid in 2026?
Liquids, apparel, regulated electronics, and perishables — return rates and compliance overhead erase margin. Per the NRF survey[2], apparel’s 24.5% return rate alone eliminates most dropshipping margin advantages.
Explore Profitable Niches With Our Team
Ready to test a niche against your real margins? Browse top-margin SKUs in our product catalog or contact our partner team for a margin analysis tailored to your store. With six global warehouses, an IQC + FQC dual inspection process, AI-powered nearest-dispatch routing, and 24/7 priority support, BLB Dropshipping exists to make every profitable niche operationally viable.
References
- US Census Bureau — Quarterly E-Commerce Report: https://www.census.gov/retail/index.html
- National Retail Federation — 2024 Retail Return Fraud Survey: https://nrf.com/research/2024-retail-return-fraud-survey
- eMarketer — US E-Commerce Forecast 2025 & Paid Social Benchmarks: https://www.emarketer.com
- Statista — Dropshipping Market Outlook 2025 / Pet Market / Smart Home Forecast: https://www.statista.com
- USPS — Publication 52 (Hazardous, Restricted, and Perishable Mail): https://pe.usps.com/cpim/display/pubs/Pub52/Pub52.htm
- Baymard Institute — Checkout Usability & Shipping Speed Research: https://baymard.com
- ShipBob — 2025 Ecommerce Fulfillment Benchmark Report: https://www.shipbob.com/blog/ecommerce-fulfillment-cost
- Littledata — 2025 Shopify Benchmark Report: https://www.littledata.com
- Fit Small Business — Dropshipping Profit Margin Survey: https://fitsmallbusiness.com
- First Insight — 2025 Consumer Sustainability Report: https://firstinsight.com
- Minea — Ad Spy & Product Validation: https://www.minea.com
- Google Trends: https://trends.google.com
Editorial & Review: This article was written by the BLB Editorial Team and reviewed by BLB Operations Leadership for supply chain accuracy. All margin, return rate, and shipping ratings are sourced from BLB internal performance records (50,000+ monthly shipments, 99.8% IQC/FQC pass rate, six global warehouses including two US facilities). External data points cite the US Census Bureau, NRF, eMarketer, Statista, USPS, Baymard Institute, ShipBob, Littledata, Fit Small Business, and First Insight. Last reviewed: August 2026. Editorial policy →